<style>
body {font-family: Arial;}
/* Style the tab */
.tab {
overflow: hidden;
border: 1px solid #ccc;
background-color: #f1f1f1;
}
/* Style the buttons inside the tab */
.tab button {
background-color: inherit;
float: left;
border: none;
outline: none;
cursor: pointer;
padding: 14px 16px;
transition: 0.3s;
font-size: 17px;
}
/* Change background color of buttons on hover */
.tab button:hover {
background-color: #ddd;
}
/* Create an active/current tablink class */
.tab button.active {
background-color: #ccc;
}
/* Style the tab content */
.tabcontent {
display: none;
padding: 6px 12px;
border: 1px solid #ccc;
border-top: none;
}
</style>
</head>
<body>
<div class="tab">
<button class="tablinks" onclick="openCity(event, 'London')">London</button>
<button class="tablinks" onclick="openCity(event, 'Paris')">Paris</button>
<button class="tablinks" onclick="openCity(event, 'Tokyo')">Tokyo</button>
</div>
<div id="London" class="tabcontent">
<h3>London</h3>
<p>London is the capital city of England.</p>
</div>
<div id="Paris" class="tabcontent">
<h3>Paris</h3>
<p>Paris is the capital of France.</p>
</div>
<div id="Tokyo" class="tabcontent">
<h3>Tokyo</h3>
<p>Tokyo is the capital of Japan.</p>
</div>
<script>
function openCity(evt, cityName) {
var i, tabcontent, tablinks;
tabcontent = document.getElementsByClassName("tabcontent");
for (i = 0; i < tabcontent.length; i++) {
tabcontent[i].style.display = "none";
}
tablinks = document.getElementsByClassName("tablinks");
for (i = 0; i < tablinks.length; i++) {
tablinks[i].className = tablinks[i].className.replace(" active", "");
}
document.getElementById(cityName).style.display = "block";
evt.currentTarget.className += " active";
}
</script>
</body>
Important
This method of printing tabsets is outdated and it is advised to use the method described in a new post.
Tl;dr
Tl;dr
Here is the version I use in my utility package jcutils.
Set the chunk option results: asis and call this method on a named list with the appropriate .f method to be called on each list element. See examples for further clarification.
#' Output List Elements as Tabset
#'
#' Map elements through `.f` and wrap each output into a tab within a tabset.
#'
#' @param .x list to be looped over, names inform tab headings.
#' @param .f function or formula. See \code{\link[purrr]{as_mapper}}.
#' @param type choice, Quarto or R Markdown. Which rendering program is used?
#' @param ... extra arguments passed to `.f`
#'
#' @return `.x` is silently returned to allow for piping.
#'
#' @export
knitr_tabset <- function(.x, .f, type = c("quarto", "rmd"), ...) {
  if (missing(.f)) .f <- print
  .f <- purrr::as_mapper(.f, ...)

  nms <- if (is.null(names(.x))) seq_along(.x) else names(.x)

  header <-
    switch(
      match.arg(type),
      quarto = ":::: {.panel-tabset}",
      rmd = "#### { .tabset .unlisted .unnumbered}"
    )

  footer <-
    switch(
      match.arg(type),
      quarto = "::::",
      rmd = "#### {.unlisted .unnumbered}"
    )

  cat(header, "\n\n", sep = "")

  for (i in seq_along(.x)) {
    cat("##### ", nms[i], "\n\n", sep = "")
    .f(.x[[i]], ...)
    cat("\n\n")
  }

  cat(footer)

  invisible(.x)
}
What are tabsets?
Tabsets are a feature of HTML and as such can be made using basic HTML code, styled using css and improved even further using javascript. See below for an example adapted from w3schools.
Show HTML source code
London
London is the capital city of England.
Paris
Paris is the capital of France.
Tokyo
Tokyo is the capital of Japan.
Quarto Syntax
Creating such a tabset in Quarto is a lot simpler and is documented here.
Thus, we can reproduce the same result with a few stylistic difference using the suggested syntax.
::: {.panel-tabset}

## London

London is the capital city of England.

## Paris

Paris is the capital of France.

## Tokyo

Tokyo is the capital of Japan.

:::
Which is a really powerful method of creating tabs when the content is known beforehand.
R Markdown Syntax
Quarto improved on functionality available in R Markdown by removing the restriction of a main heading level.
In R markdown, tabsets require a section heading at some level, say h2, and then all subsequent tabs can be split by h3 headings. Further to symbolise the end of the tabset, an empty h2 header is required which would often disrupt table of contents functionality.
See R markdown cookbook for more information.
In my experience, if the heading is not one degree apart, the tabs simply don’t work and default to normal sections.
For example
## Capitals {.tabset}

Default tab

### London

London is the capital city of England.

### Paris

Paris is the capital of France.

### Tokyo

Tokyo is the capital of Japan.

## {-}
Motivation
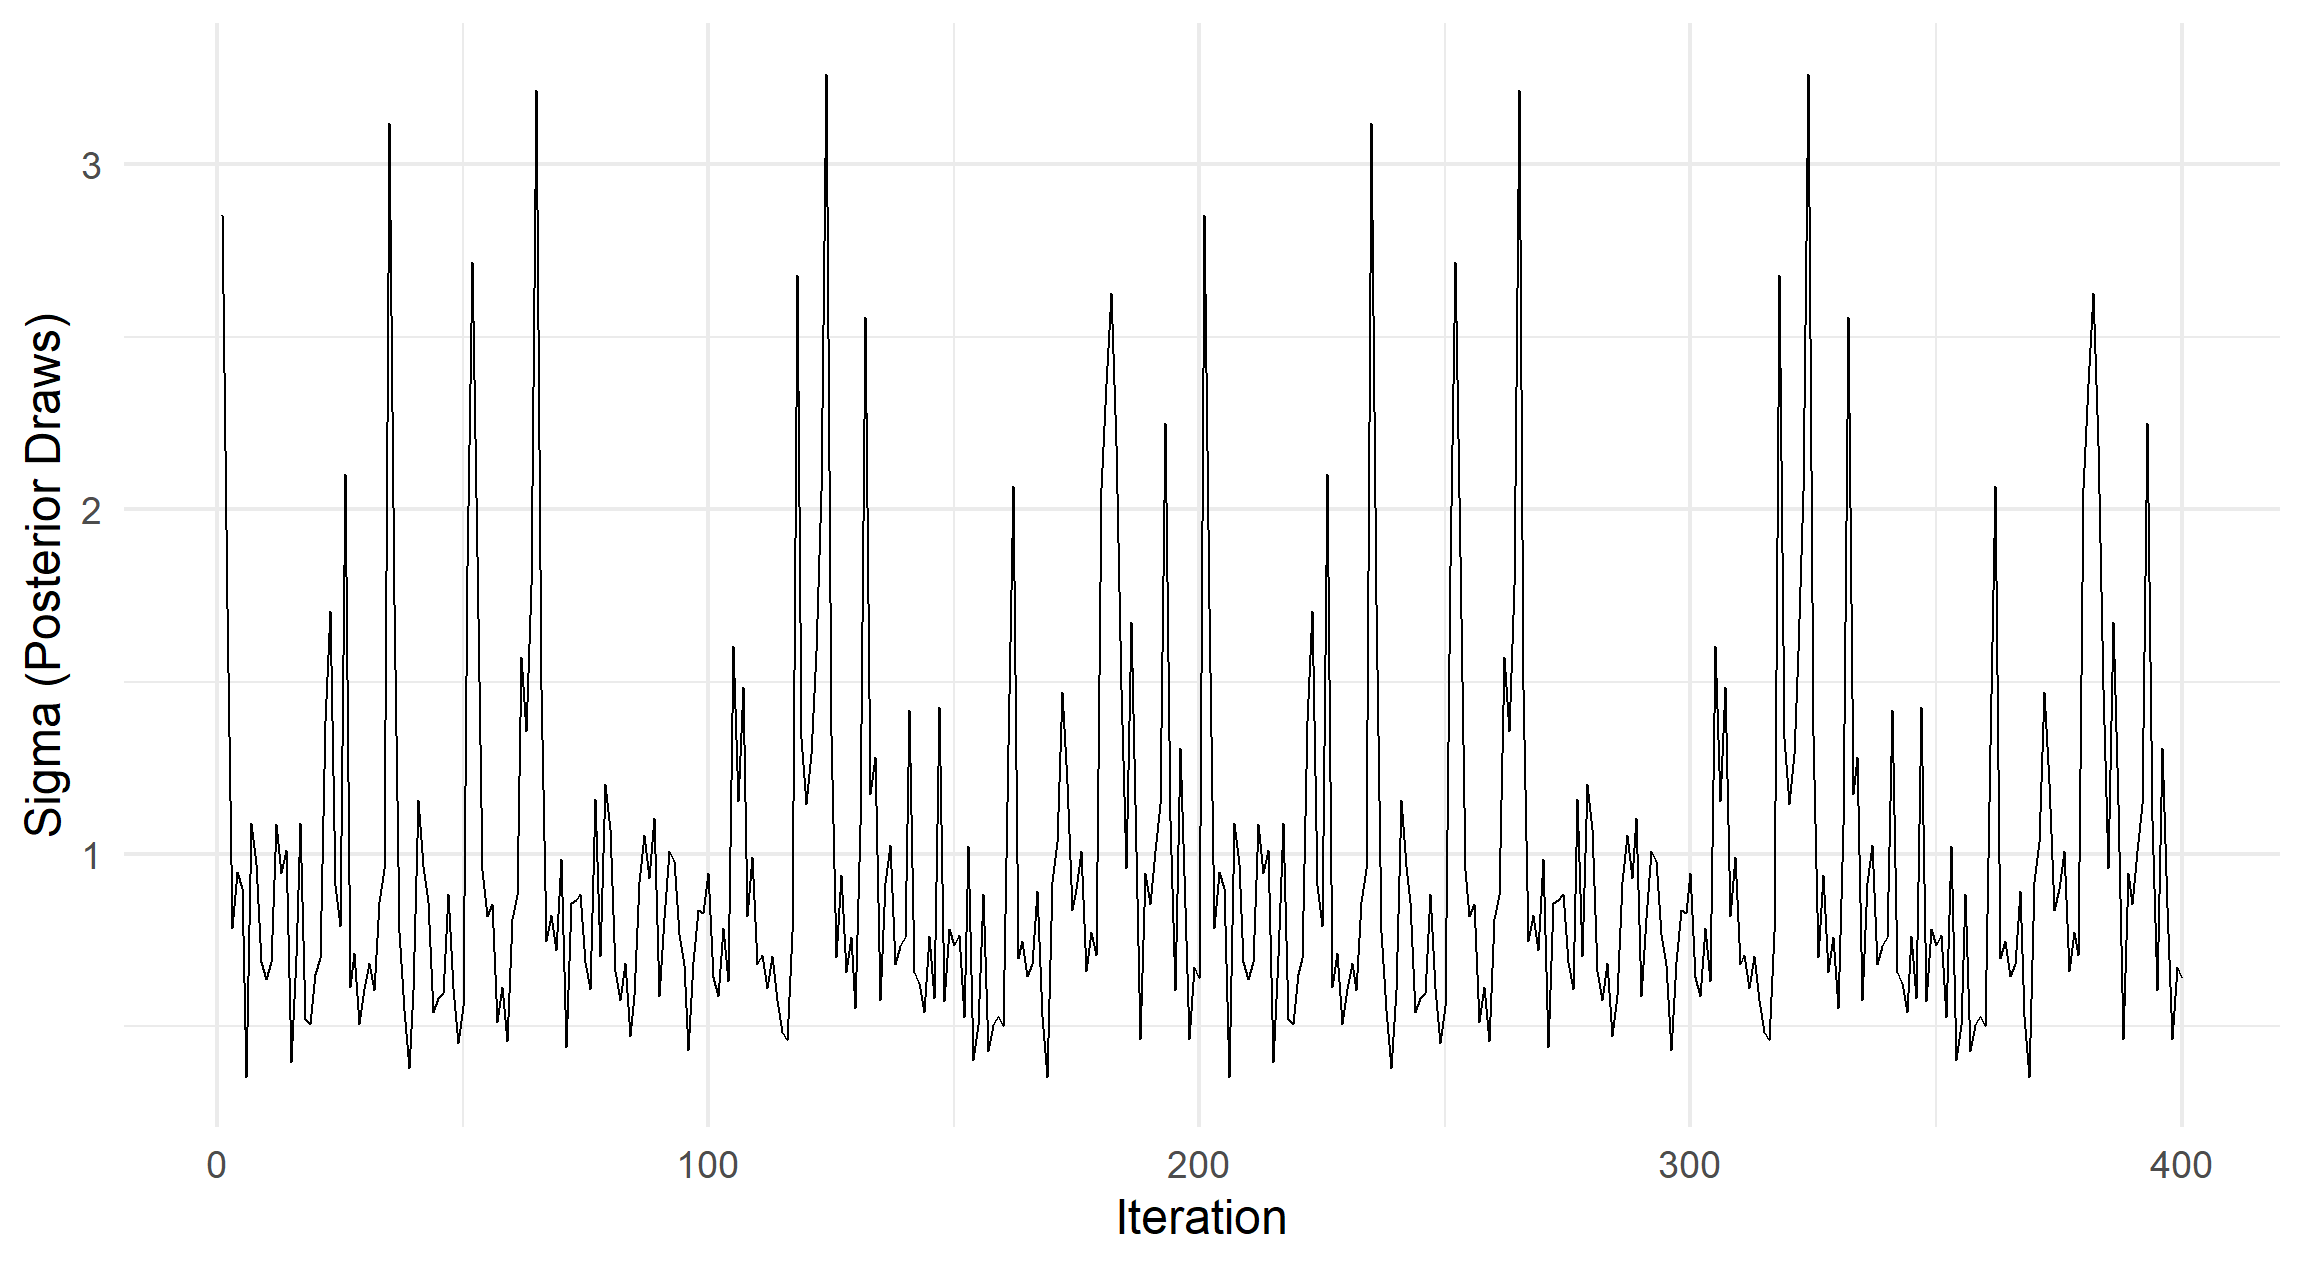
In my research, I often worked with MCMC output and would want one tab per each chain of output. For a parameterised report, the number of chains is not constant, may change and prohbit using the previos syntax.
We can instead use results: asis to programmatically make tabsets.
#| results: asis
mcmc_eg <- mcmcr::mcmcr_example$sigma
n_chains <- mcmcr::nchains(mcmc_eg)
n_iters <- mcmcr::niters(mcmc_eg)

cat("::: {.panel-tabset}")

for (i in seq_len(n_chains)) {
  cat("\n", sprintf("## Chain %i", i), "\n\n", sep = "")

  p <-
    ggplot2::qplot(
      x = seq_len(n_iters),
      xlab = "Iteration",
      y = mcmc_eg[i, , ],
      ylab = "Sigma (Posterior Draws)",
      geom = "line"
    )

  print(p)
}

cat(":::")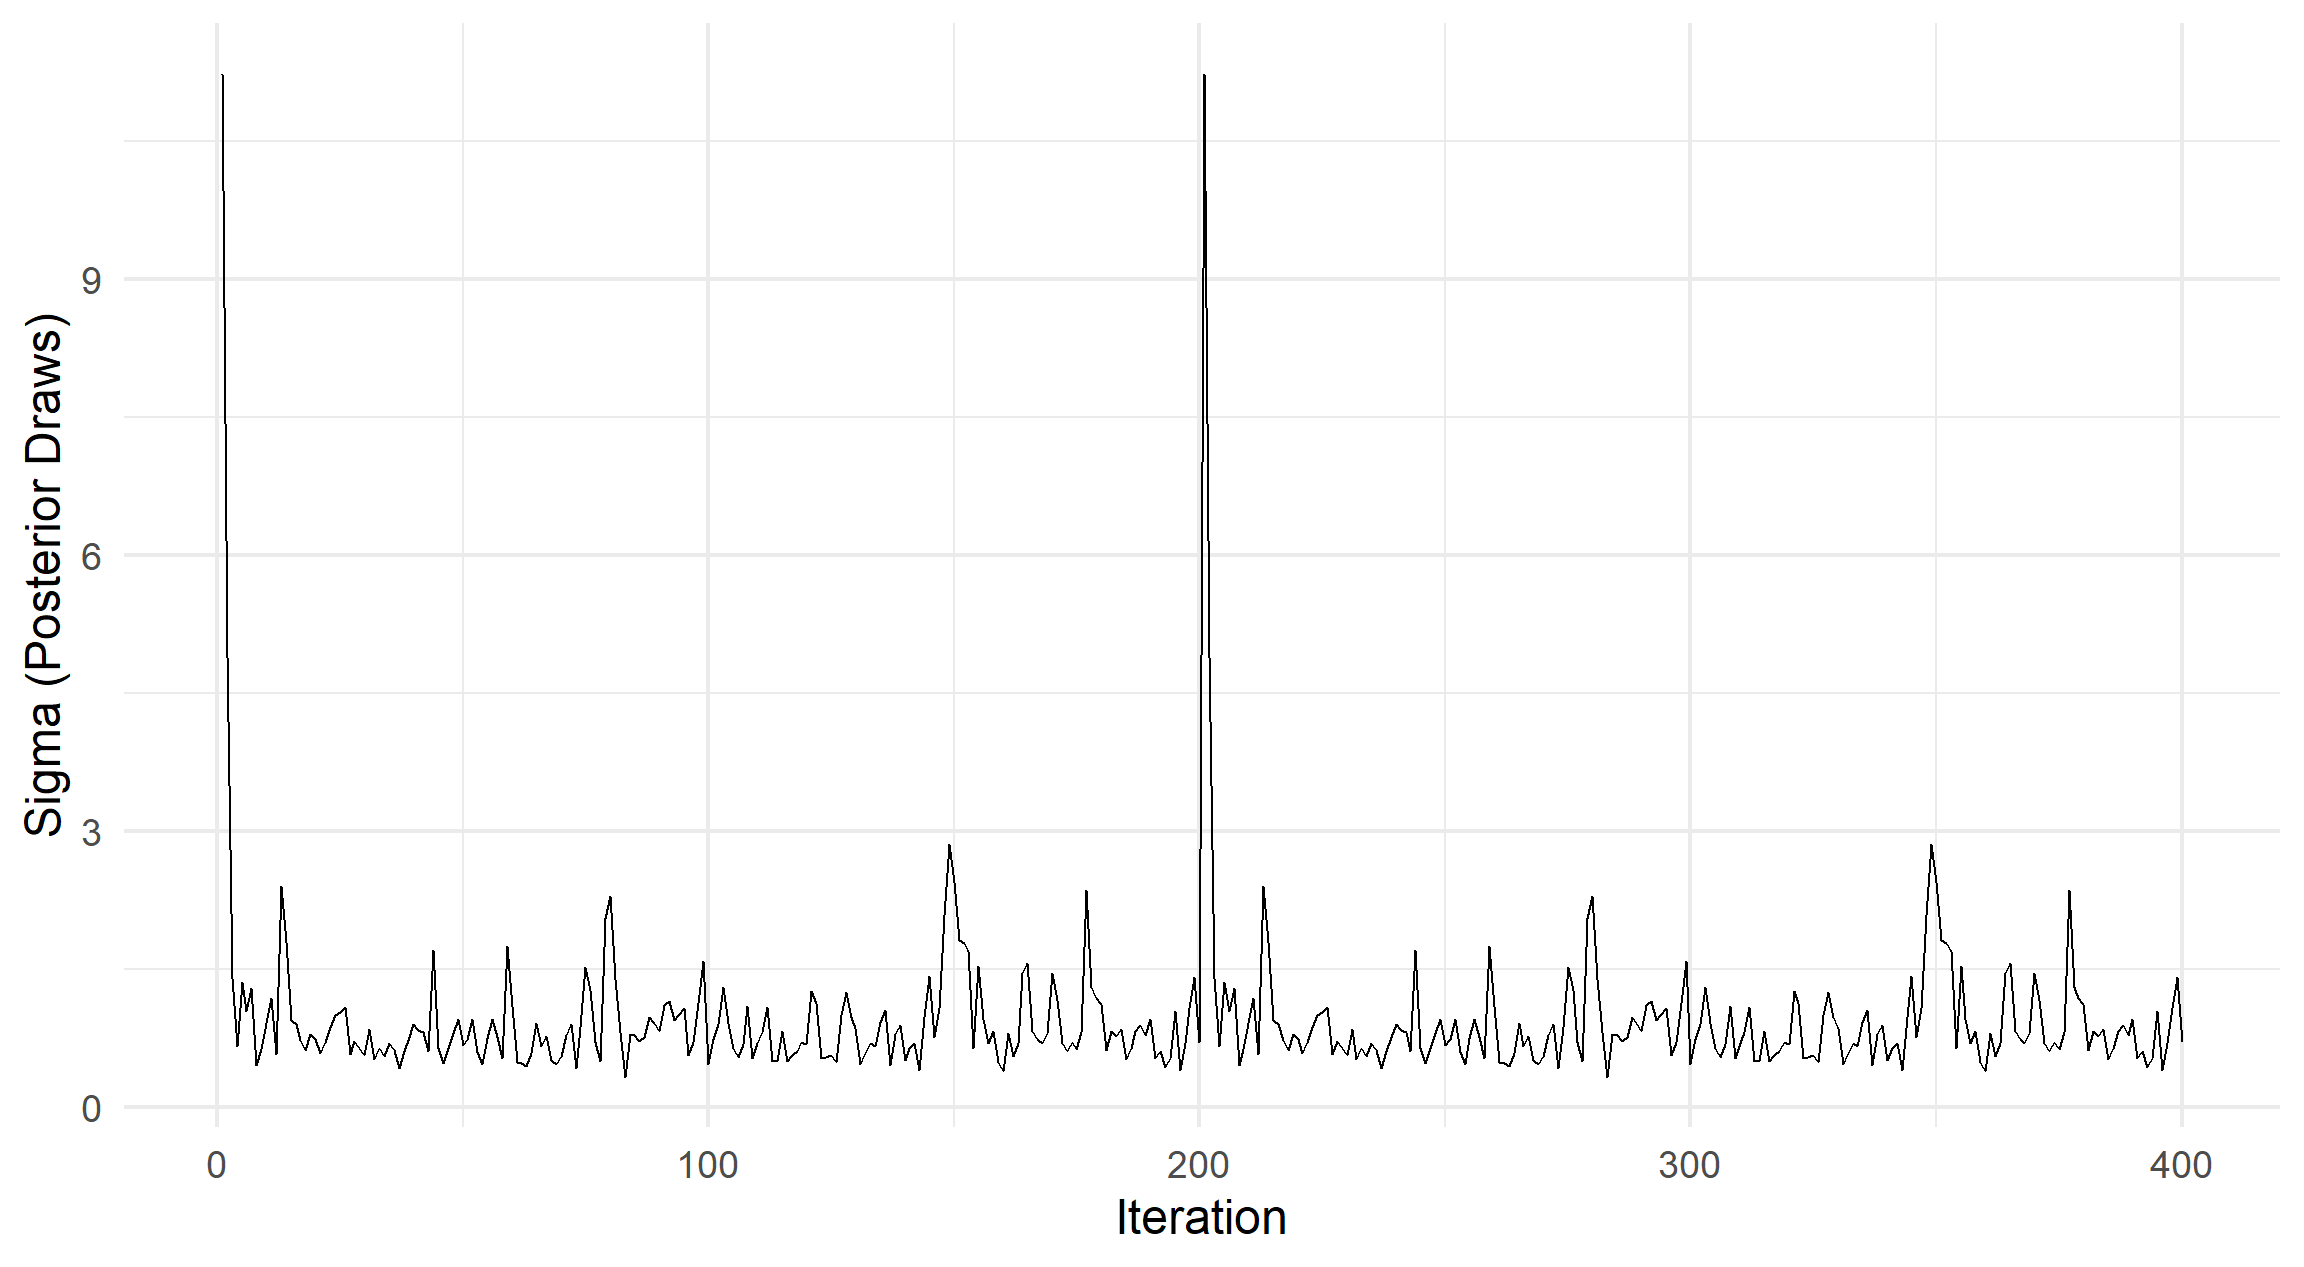
We want to use this code pattern multiple times, so ideally it can be extracted into a new function.
Mapping Function
In the previous example, each list element is plotted, but what about where each element in plain text? a kable object? We could change to print but that leads to issues with gt in my experience.
Here is the version of the function I currently use, if there are any issues let me know in the comments below this post.
knitr_tabset <- function(.x, .f, type = c("quarto", "rmd"), ...) {
  if (missing(.f)) .f <- print
  .f <- purrr::as_mapper(.f, ...)

  nms <- if (is.null(names(.x))) seq_along(.x) else names(.x)

  header <-
    switch(
      match.arg(type),
      quarto = ":::: {.panel-tabset}",
      rmd = "#### { .tabset .unlisted .unnumbered}"
    )

  footer <-
    switch(
      match.arg(type),
      quarto = "::::",
      rmd = "#### {.unlisted .unnumbered}"
    )

  cat(header, "\n\n", sep = "")

  for (i in seq_along(.x)) {
    cat("##### ", nms[i], "\n\n", sep = "")
    .f(.x[[i]], ...)
    cat("\n\n")
  }

  cat(footer)

  invisible(.x)
}
Looking at the source, we see a few key decisions, such as:
tabsets are named according to the same logic in
purrr::imap;the logic applied to each element can be changed to an arbitrary function;
Quarto or R markdown syntax is supported.
Note
For the R Markdown version, we simply use an empty heading that is unlisted and unnumbered.
Note
Since this method is to be called for its side effects, we return the original object to allow better piping. So x_new <- x %>% knit_tabset() %>% transform() is equivalent to knit_tabset(x) and x_new <- transform(x).
Examples
Each of these examples are applied on simple polynomial data and must also have the chunk options results: asis (not shown).
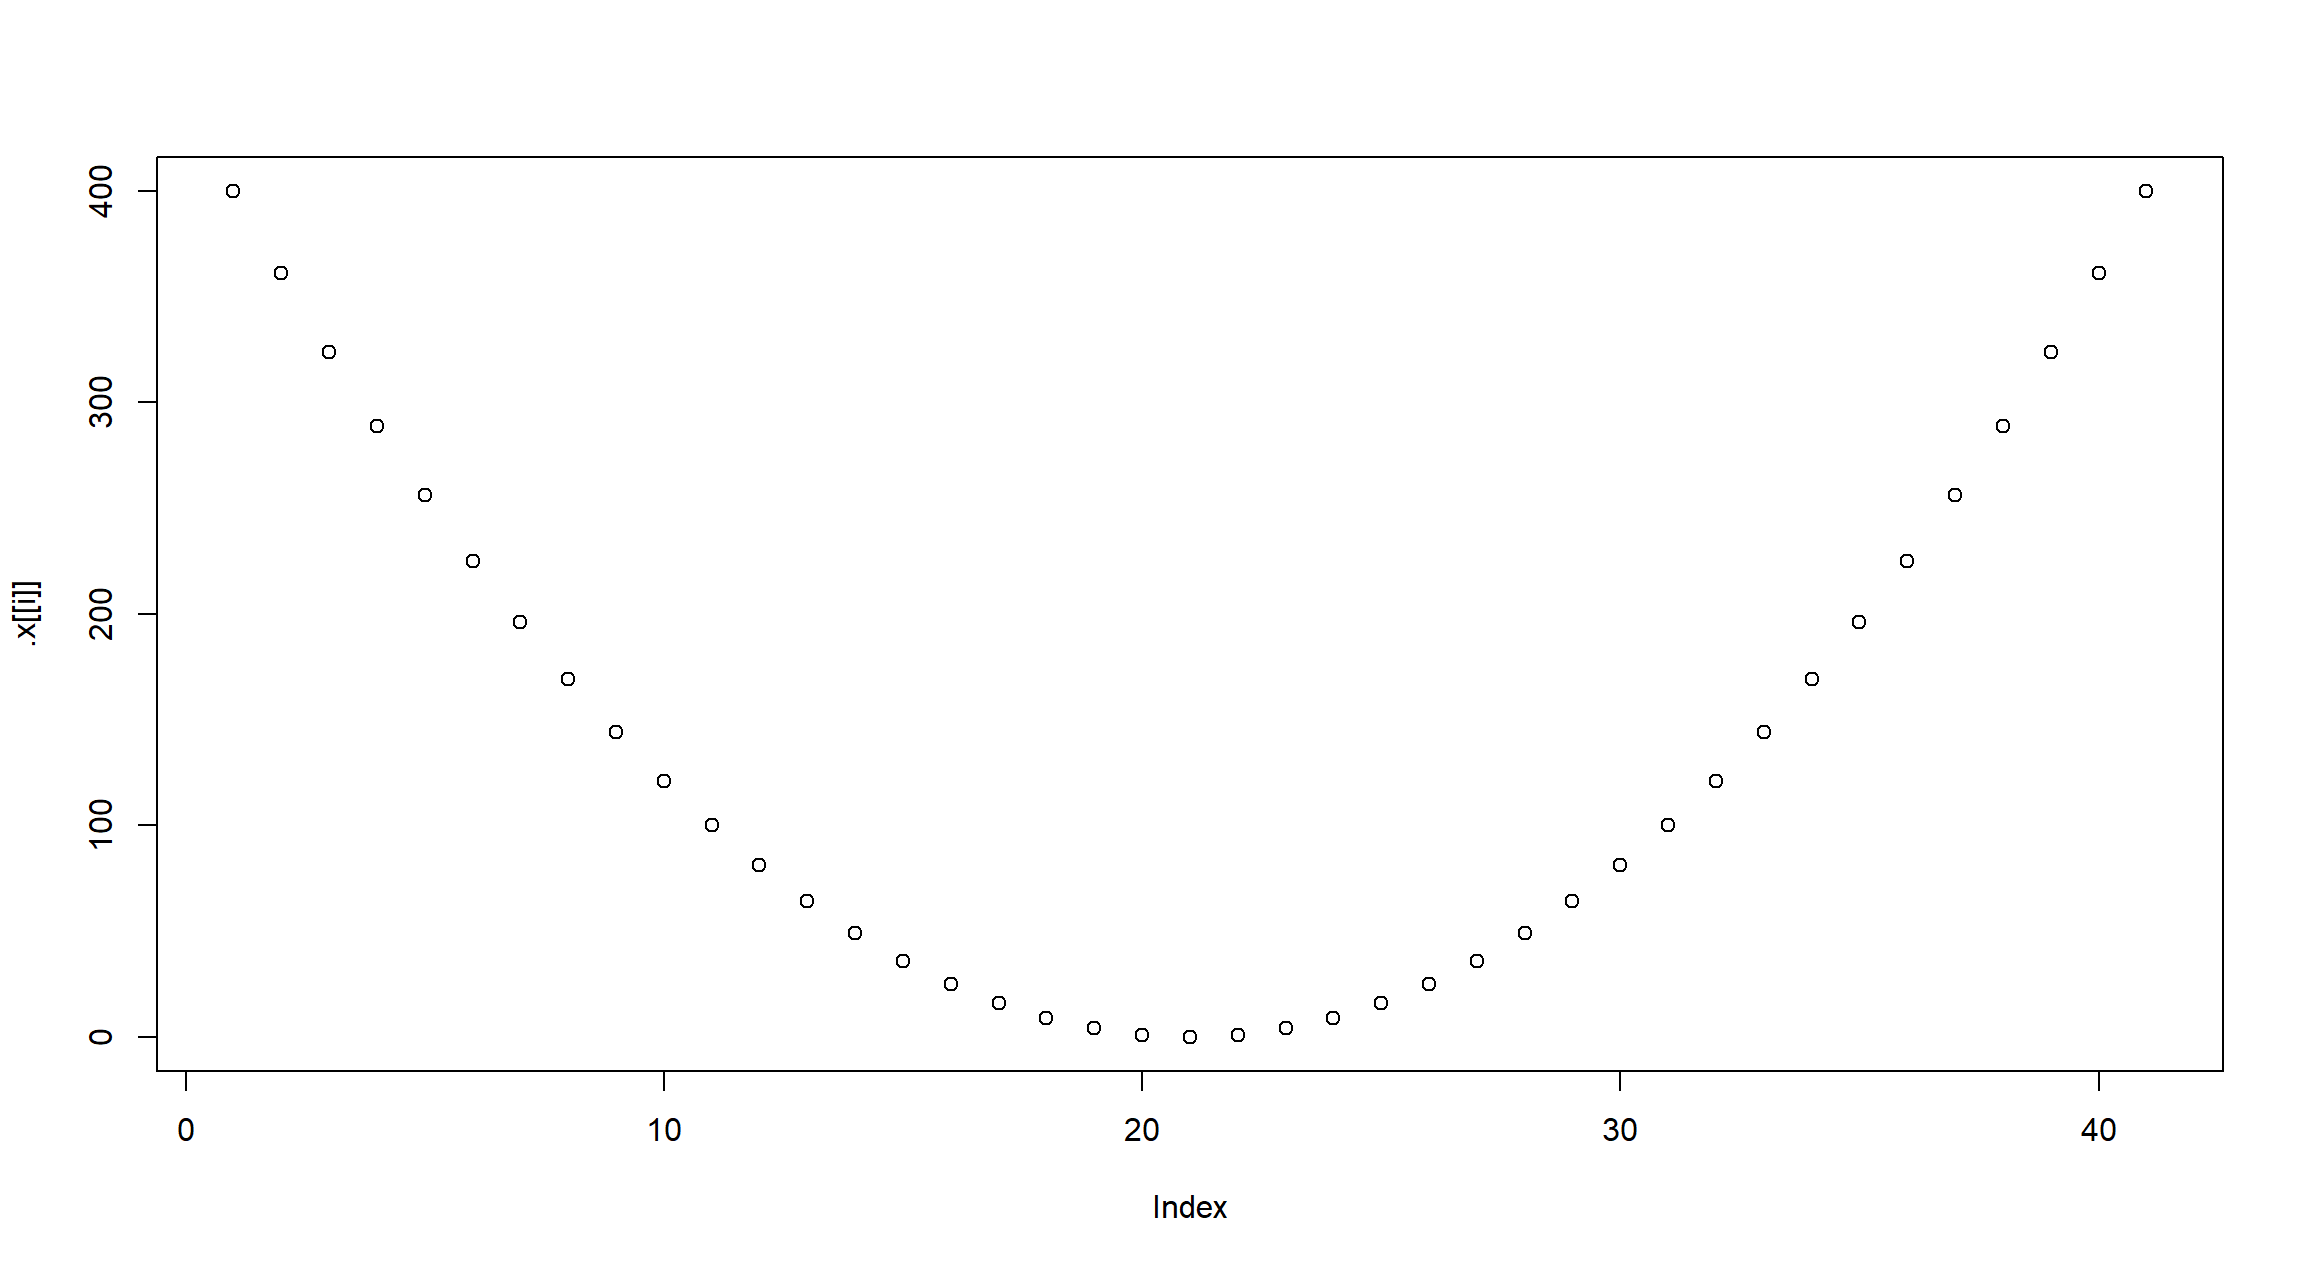
x <- seq(from = -20, to = 20, by = 1)

y <- lapply(seq_len(4), function(n) x^n)
names(y) <- paste0("X^", seq_len(4))
String Printing
knitr_tabset(y, ~ print(toString(.x)))[1] “-20, -19, -18, -17, -16, -15, -14, -13, -12, -11, -10, -9, -8, -7, -6, -5, -4, -3, -2, -1, 0, 1, 2, 3, 4, 5, 6, 7, 8, 9, 10, 11, 12, 13, 14, 15, 16, 17, 18, 19, 20”
[1] “400, 361, 324, 289, 256, 225, 196, 169, 144, 121, 100, 81, 64, 49, 36, 25, 16, 9, 4, 1, 0, 1, 4, 9, 16, 25, 36, 49, 64, 81, 100, 121, 144, 169, 196, 225, 256, 289, 324, 361, 400”
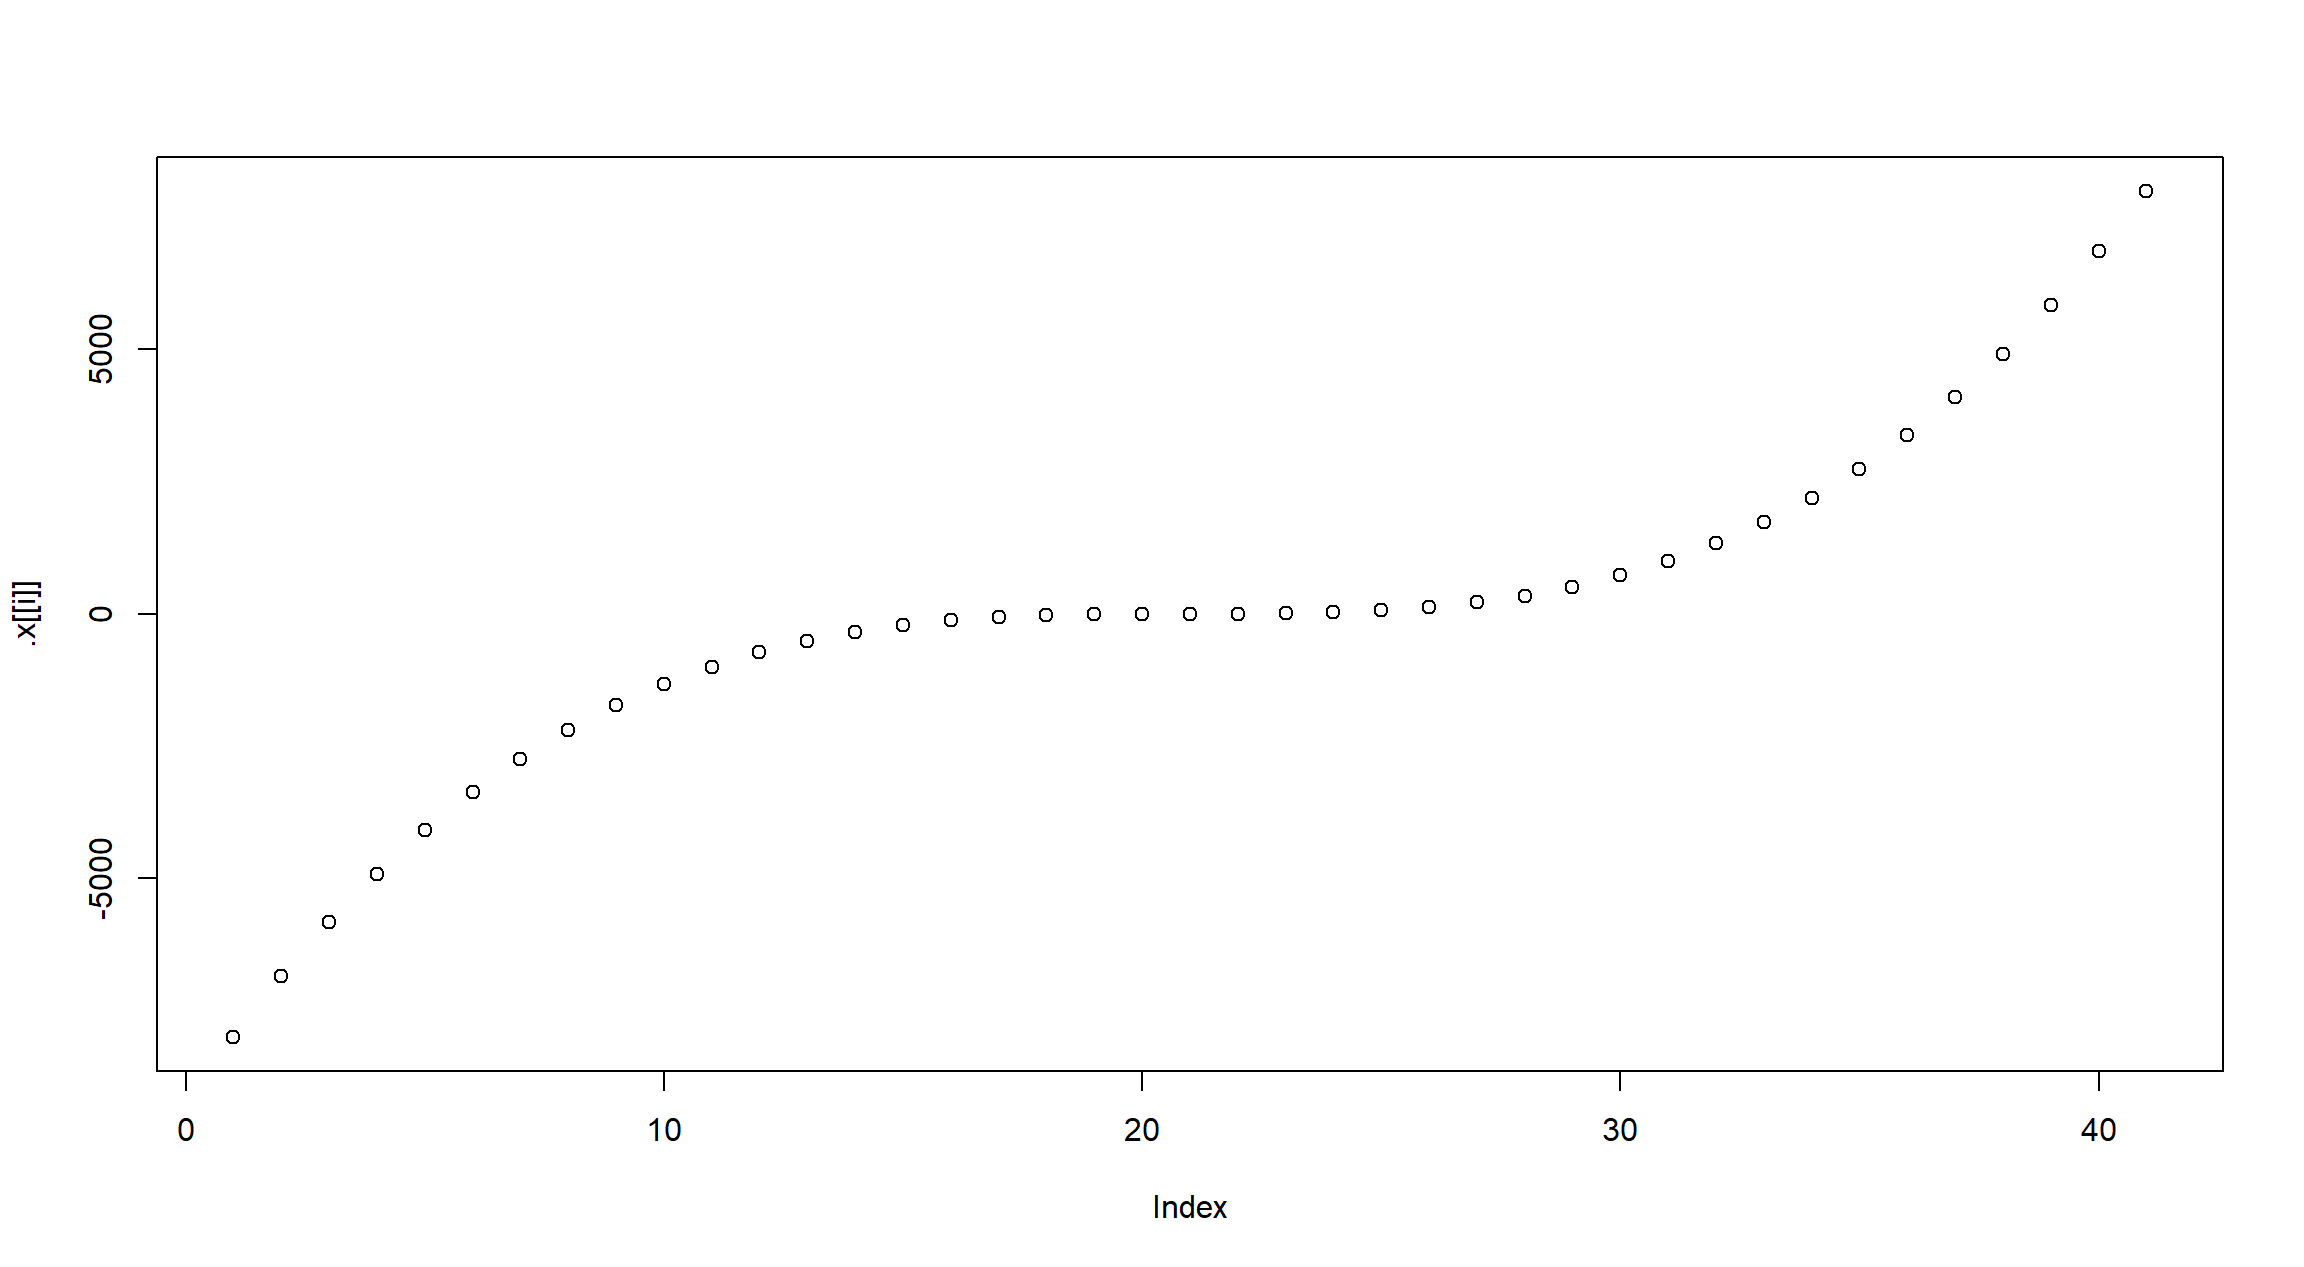
[1] “-8000, -6859, -5832, -4913, -4096, -3375, -2744, -2197, -1728, -1331, -1000, -729, -512, -343, -216, -125, -64, -27, -8, -1, 0, 1, 8, 27, 64, 125, 216, 343, 512, 729, 1000, 1331, 1728, 2197, 2744, 3375, 4096, 4913, 5832, 6859, 8000”
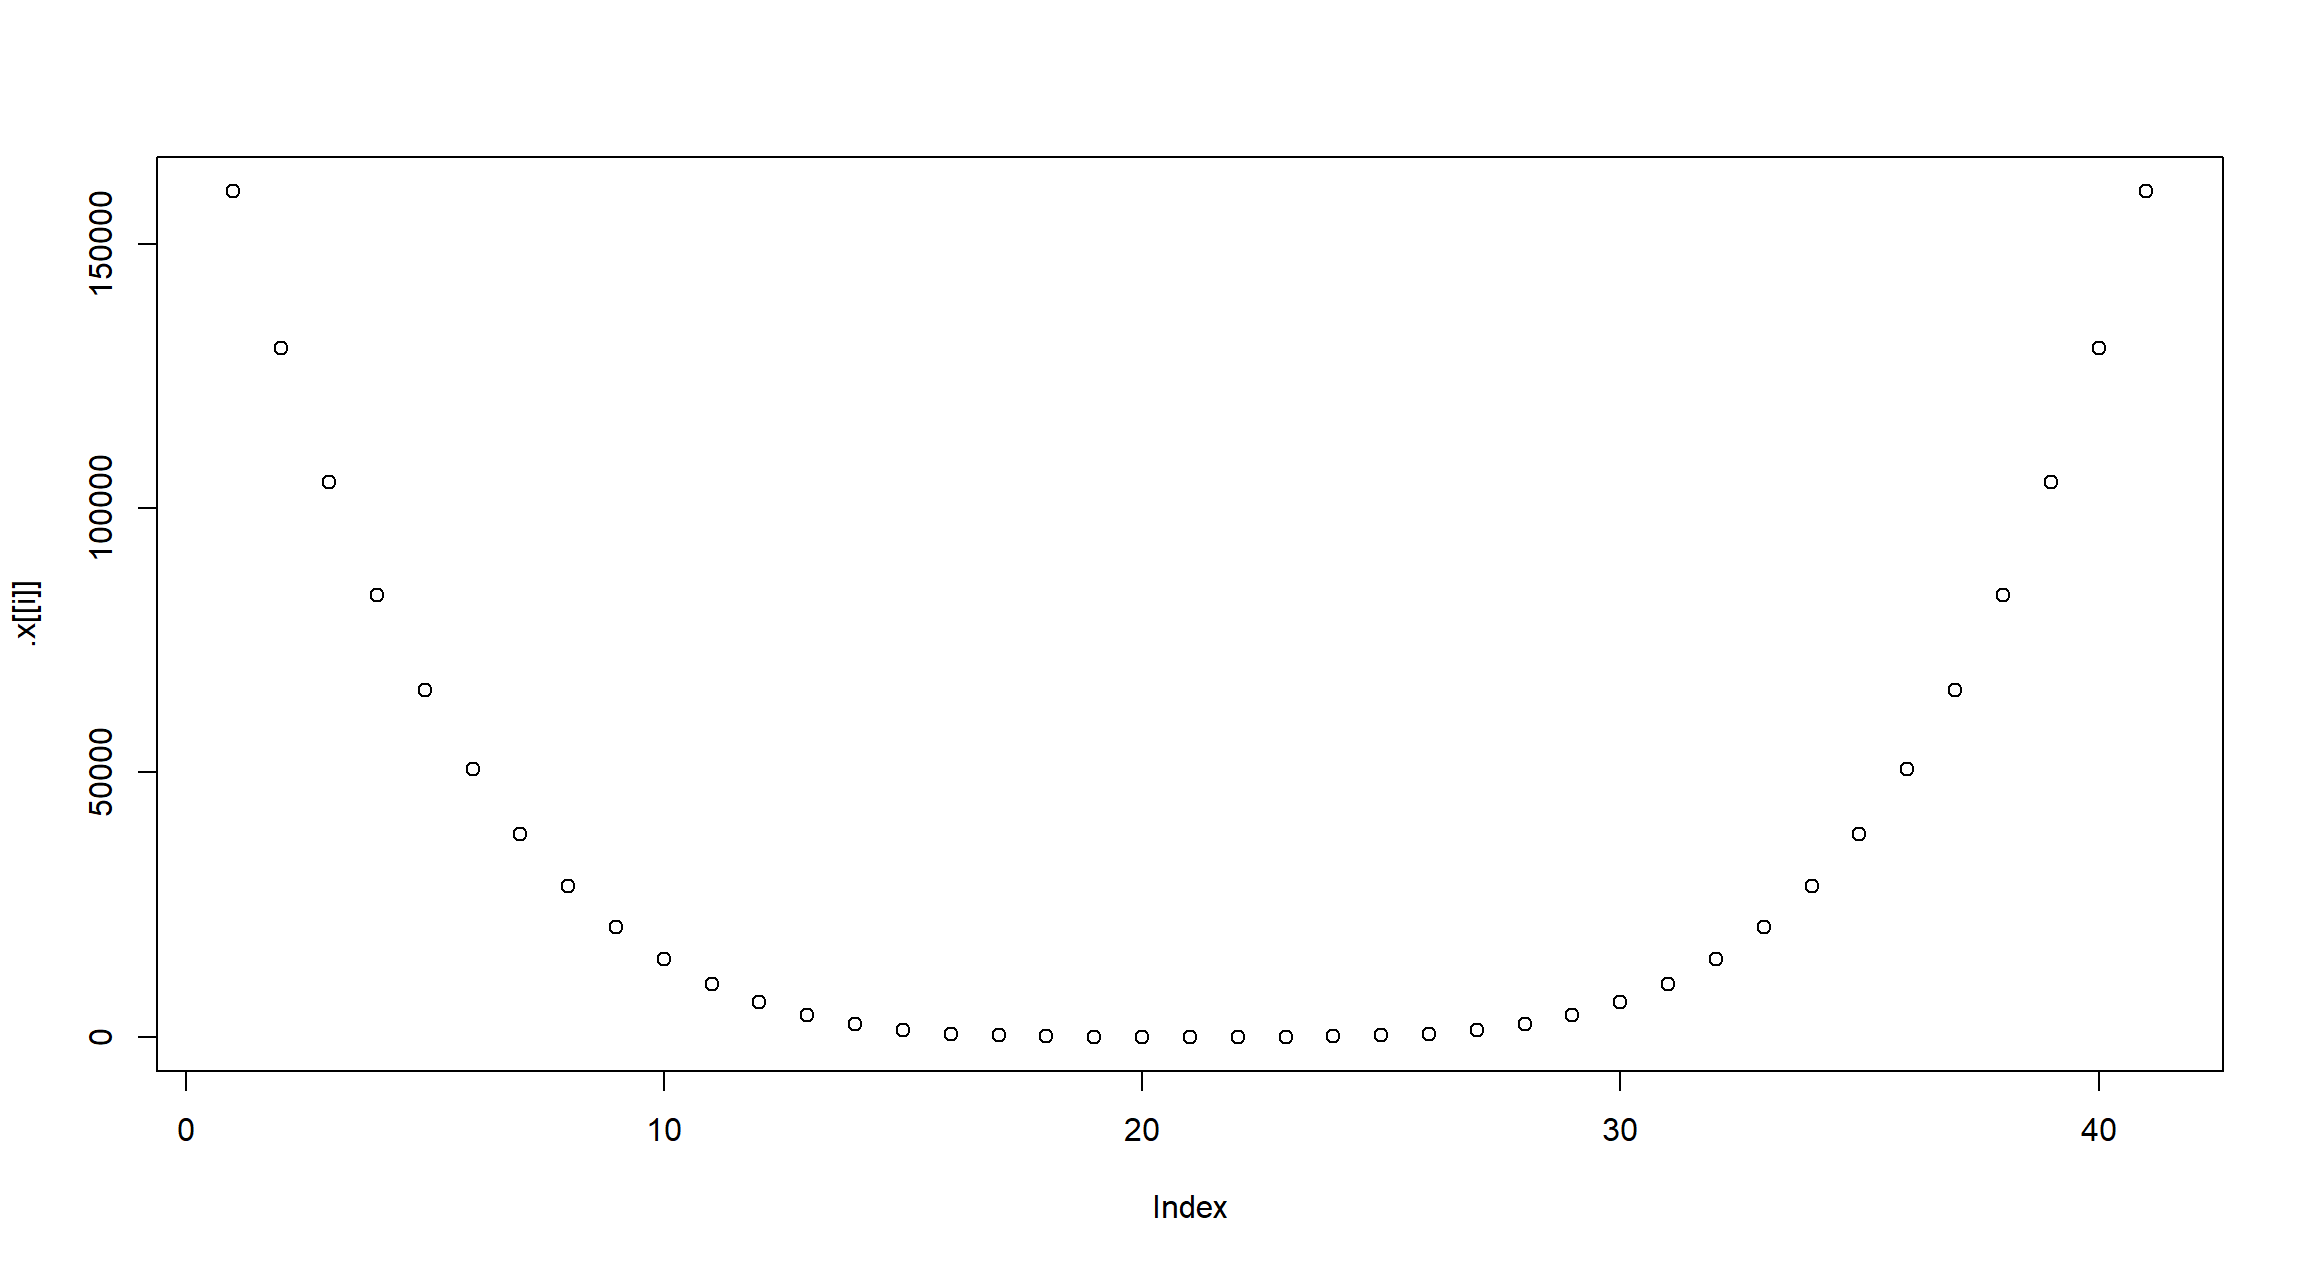
[1] “160000, 130321, 104976, 83521, 65536, 50625, 38416, 28561, 20736, 14641, 10000, 6561, 4096, 2401, 1296, 625, 256, 81, 16, 1, 0, 1, 16, 81, 256, 625, 1296, 2401, 4096, 6561, 10000, 14641, 20736, 28561, 38416, 50625, 65536, 83521, 104976, 130321, 160000”
knitr_tabset(y, ~ cat(toString(.x)))-20, -19, -18, -17, -16, -15, -14, -13, -12, -11, -10, -9, -8, -7, -6, -5, -4, -3, -2, -1, 0, 1, 2, 3, 4, 5, 6, 7, 8, 9, 10, 11, 12, 13, 14, 15, 16, 17, 18, 19, 20
400, 361, 324, 289, 256, 225, 196, 169, 144, 121, 100, 81, 64, 49, 36, 25, 16, 9, 4, 1, 0, 1, 4, 9, 16, 25, 36, 49, 64, 81, 100, 121, 144, 169, 196, 225, 256, 289, 324, 361, 400
-8000, -6859, -5832, -4913, -4096, -3375, -2744, -2197, -1728, -1331, -1000, -729, -512, -343, -216, -125, -64, -27, -8, -1, 0, 1, 8, 27, 64, 125, 216, 343, 512, 729, 1000, 1331, 1728, 2197, 2744, 3375, 4096, 4913, 5832, 6859, 8000
160000, 130321, 104976, 83521, 65536, 50625, 38416, 28561, 20736, 14641, 10000, 6561, 4096, 2401, 1296, 625, 256, 81, 16, 1, 0, 1, 16, 81, 256, 625, 1296, 2401, 4096, 6561, 10000, 14641, 20736, 28561, 38416, 50625, 65536, 83521, 104976, 130321, 160000
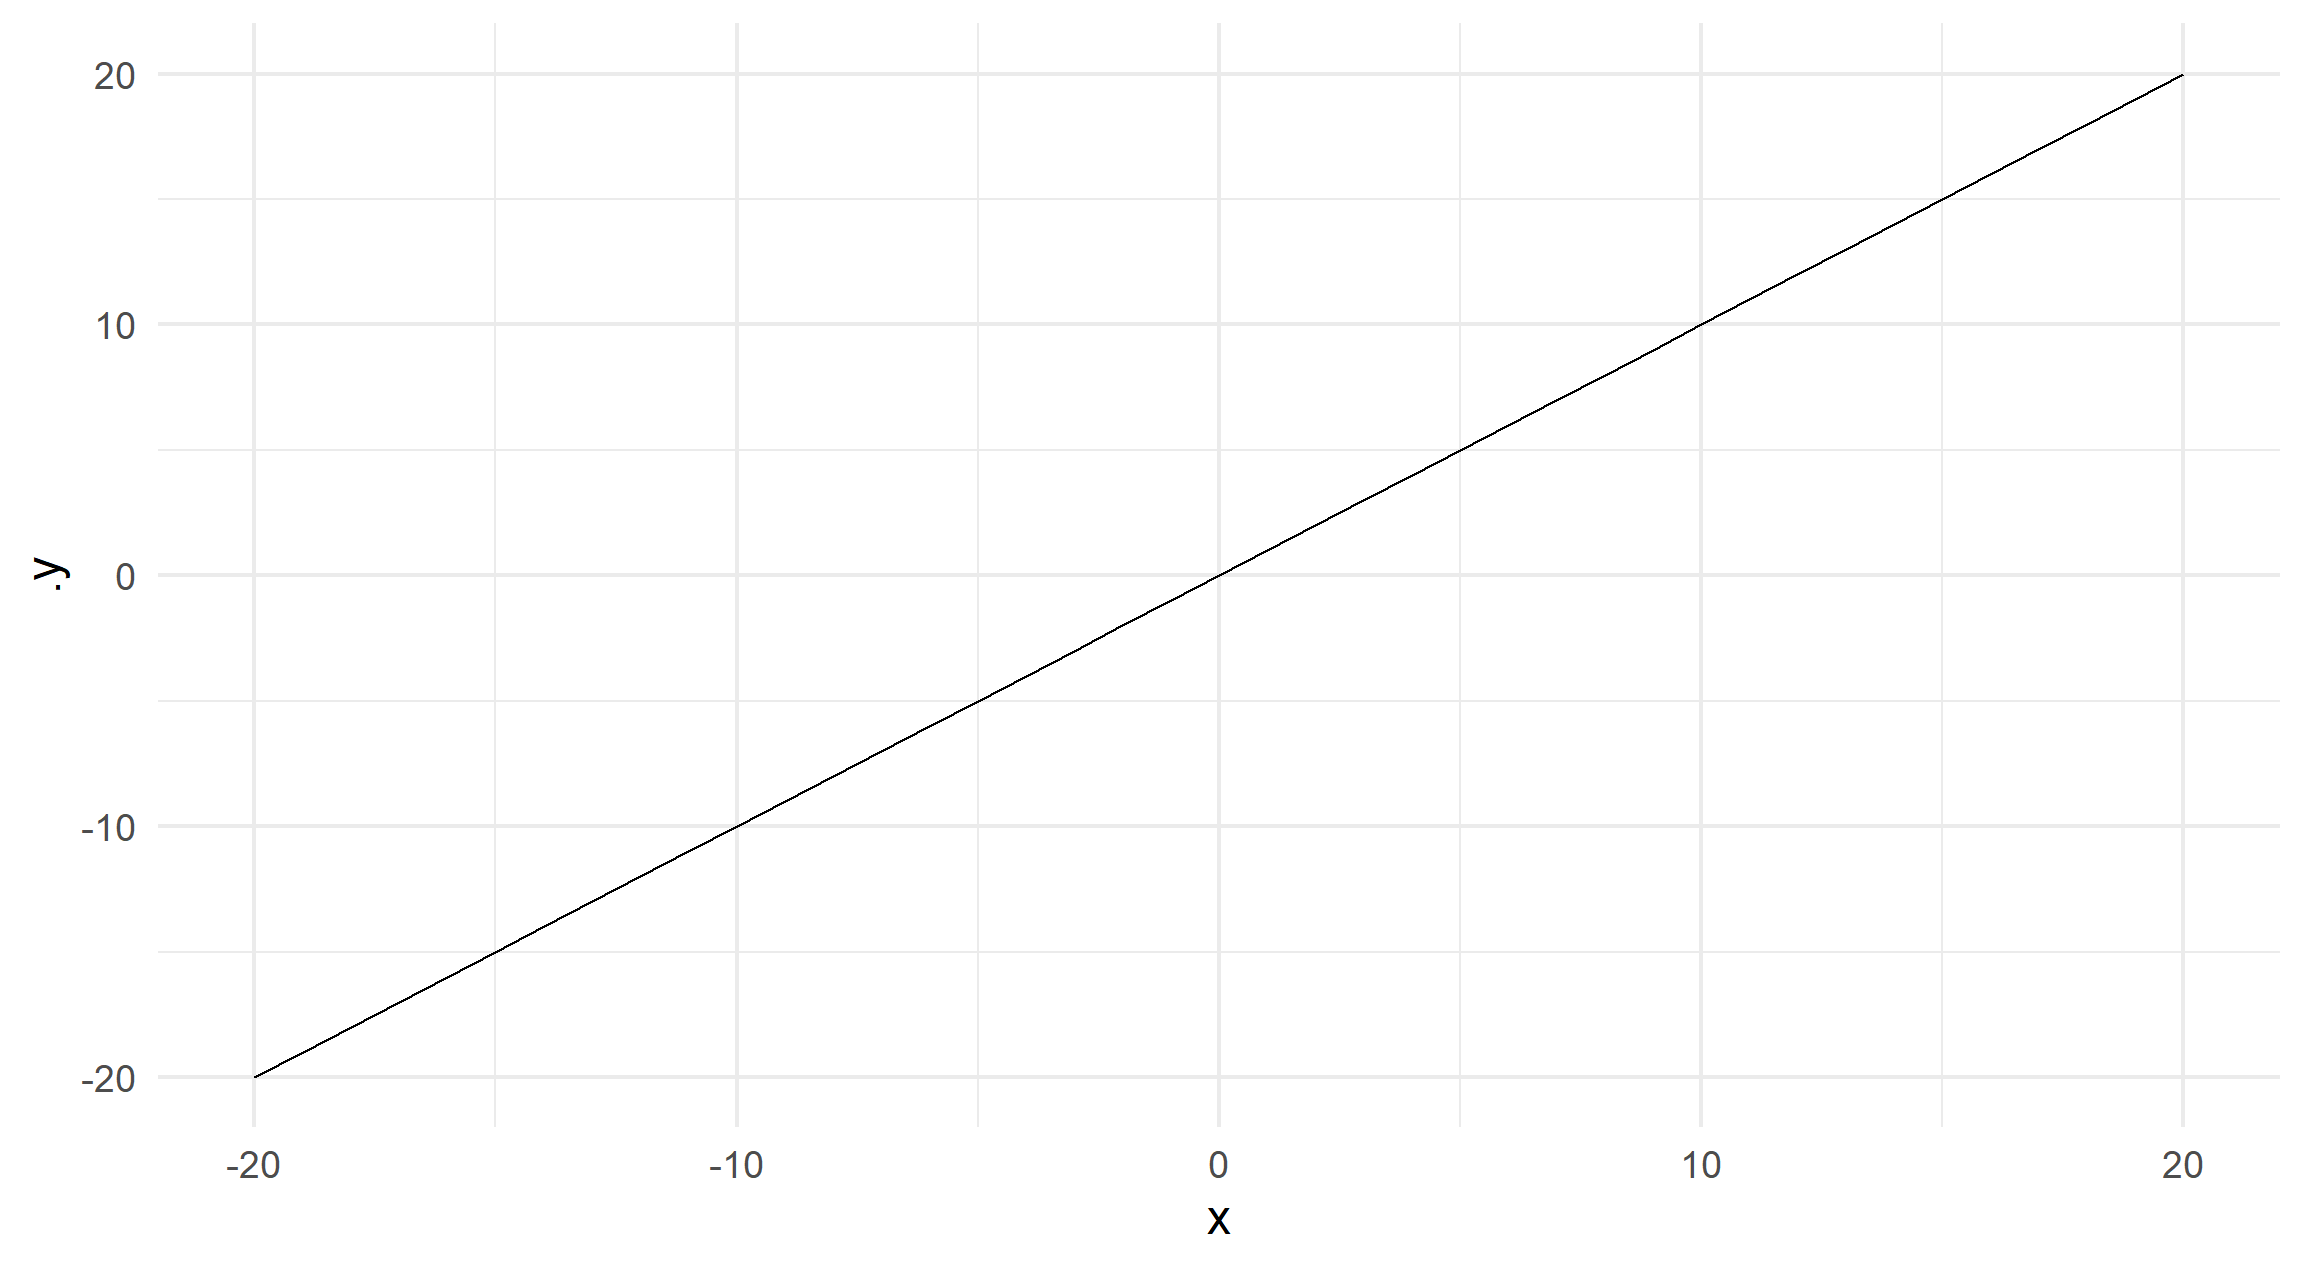
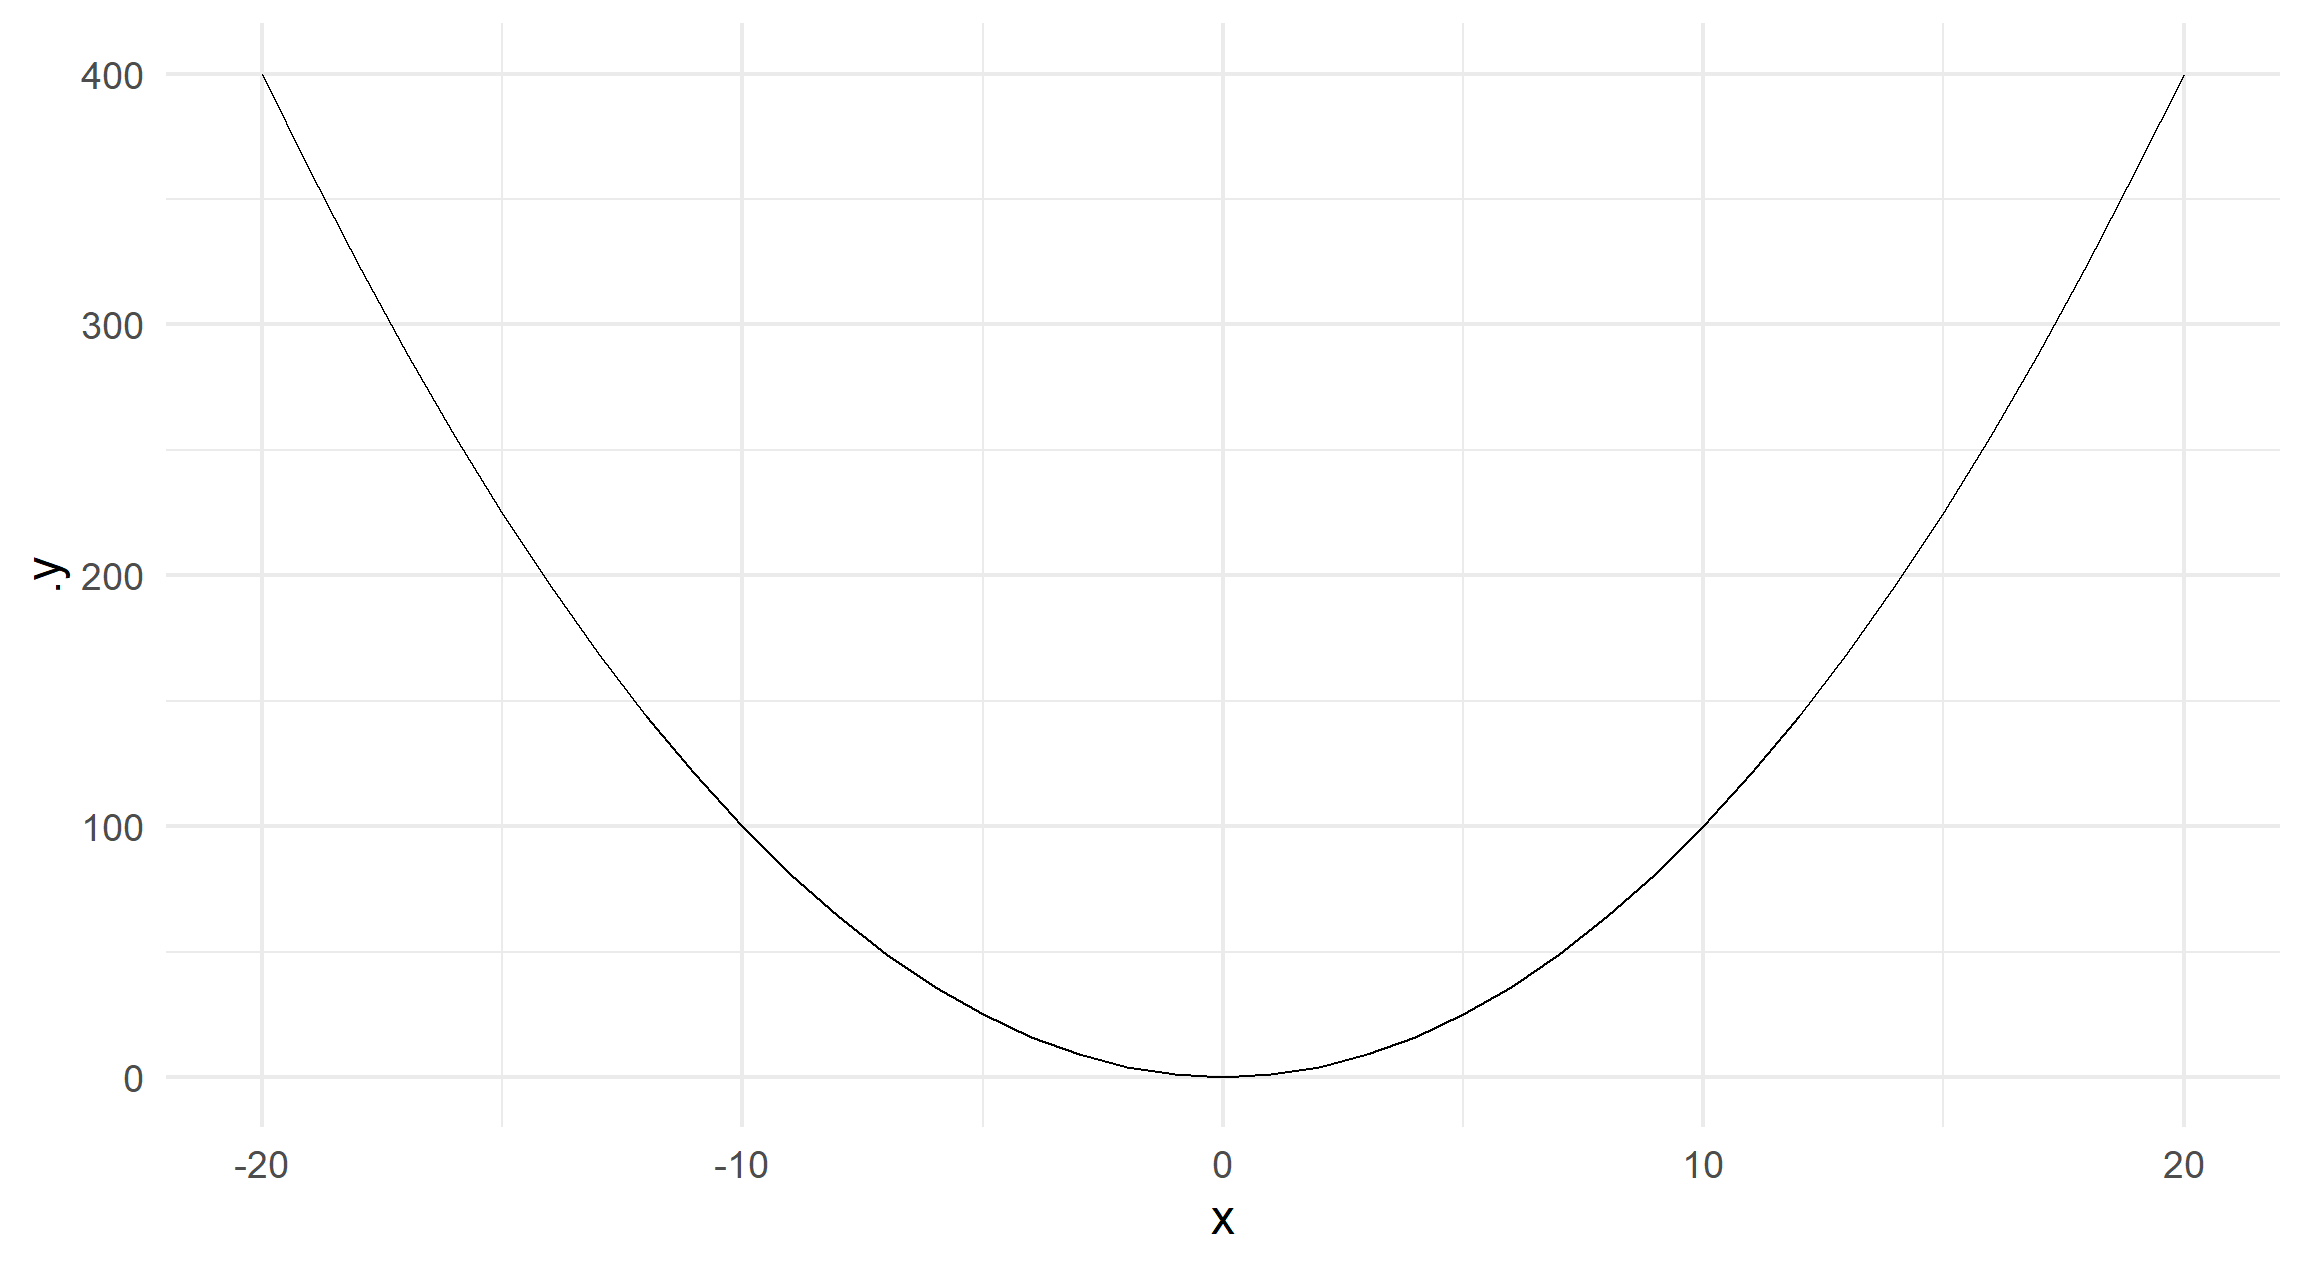
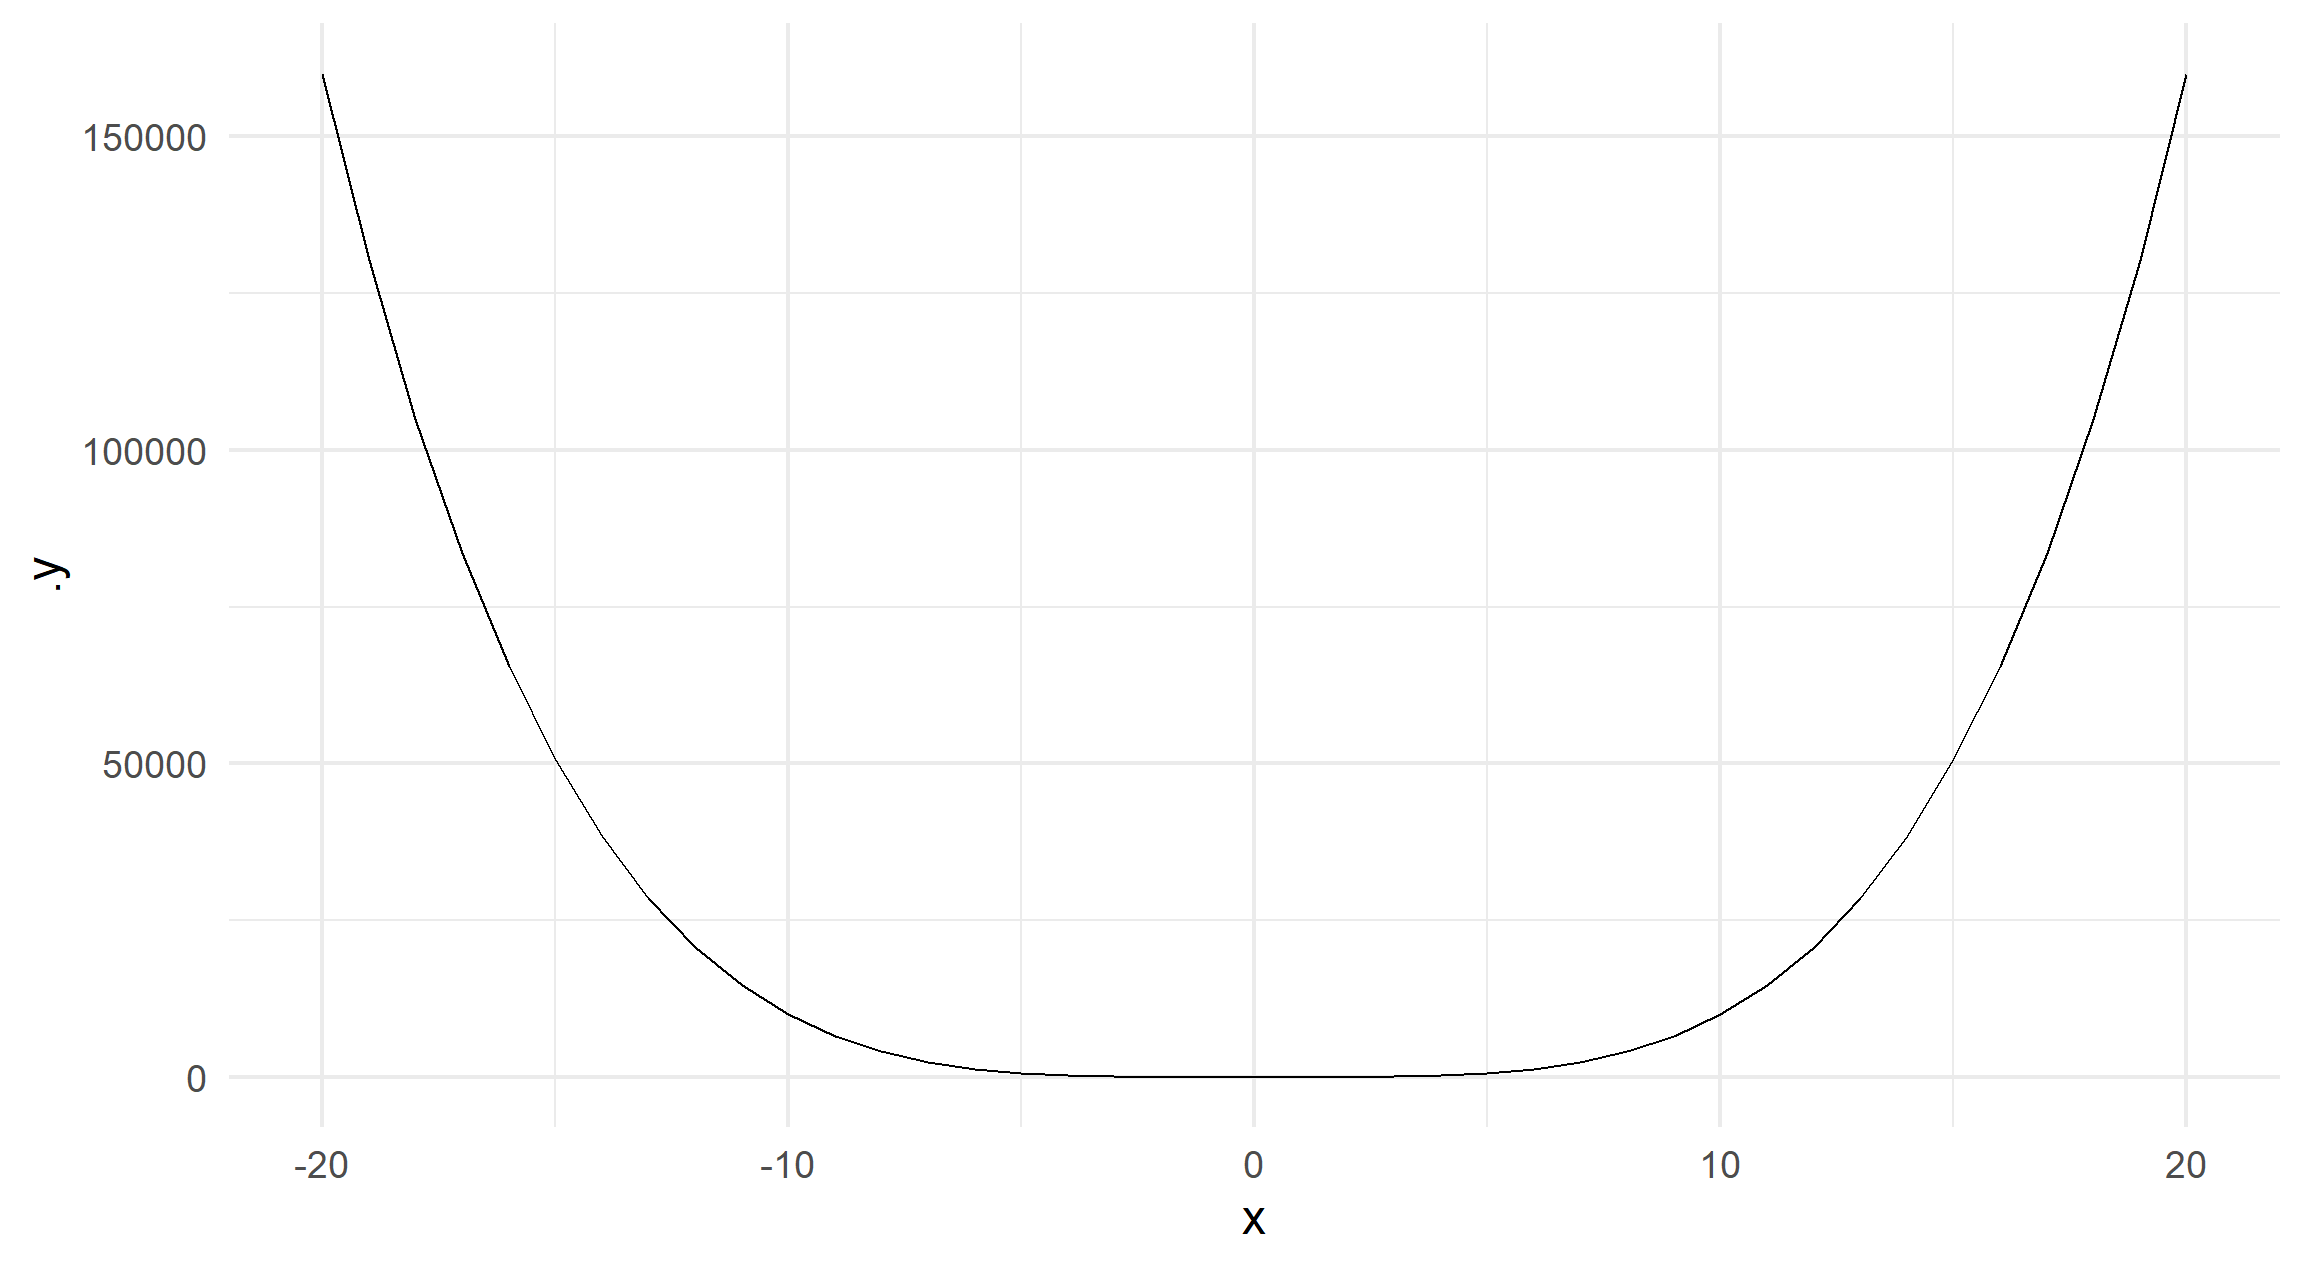
ggplot2
y_plots <- lapply(y, function(.y) ggplot2::qplot(x, .y, geom = "line"))
knitr_tabset(y, plot)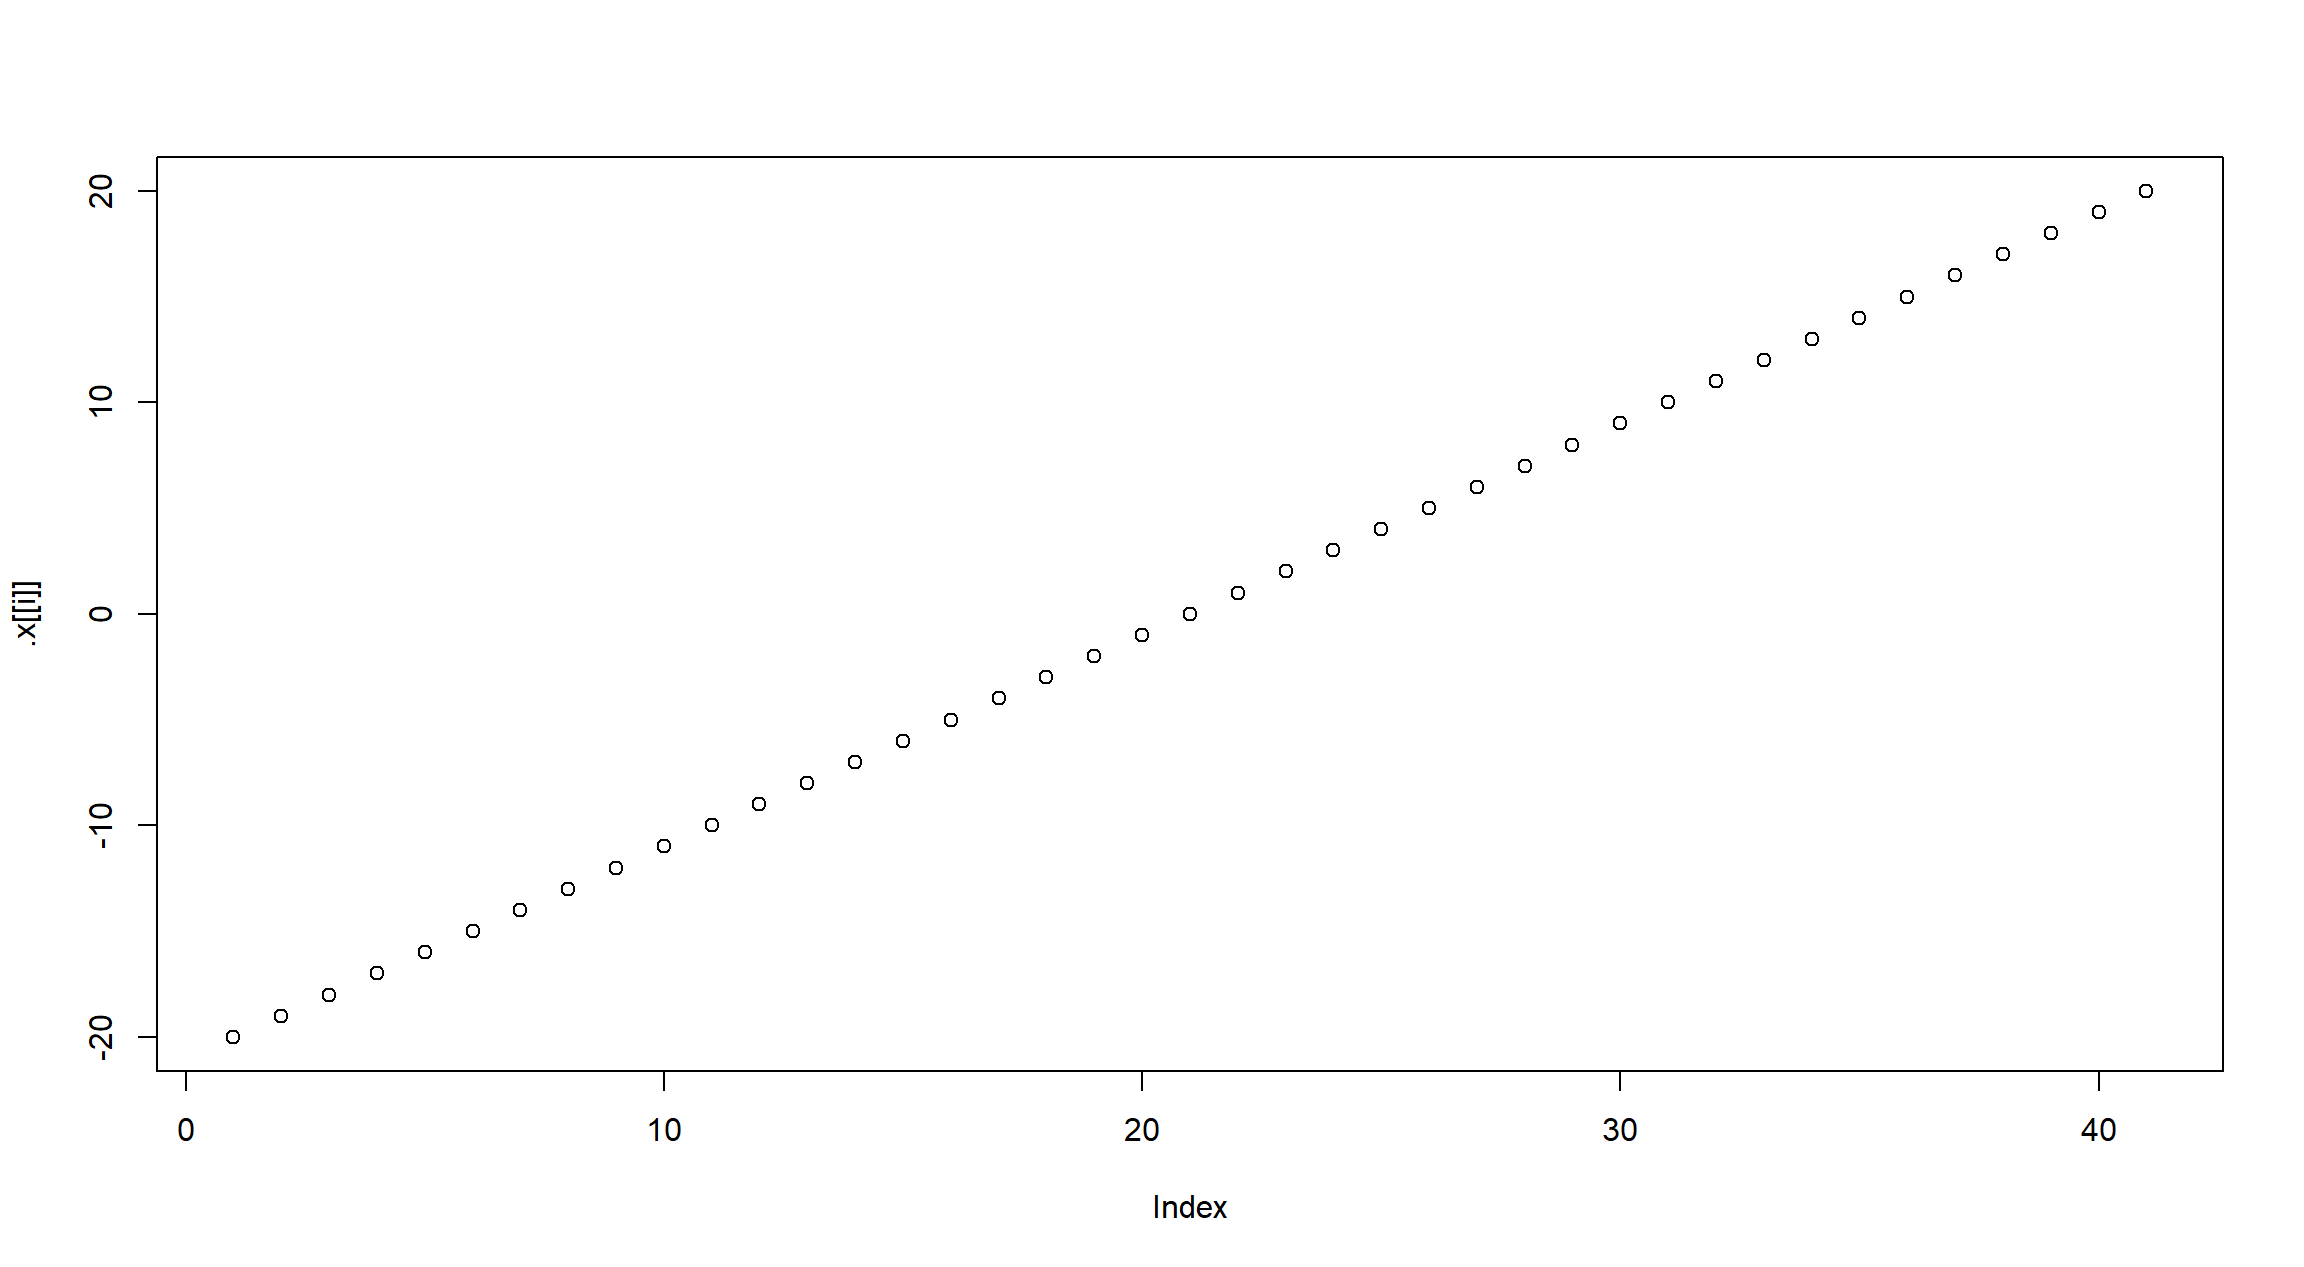
kable
y_summary <-
  lapply(y, function(.y) tibble::enframe(summary(.y), "Statistic", "Value"))

y_kables <- lapply(y_summary, knitr::kable)

knitr_tabset(y_kables, print)| Statistic | Value |
|---|---|
| Min. | -20 |
| 1st Qu. | -10 |
| Median | 0 |
| Mean | 0 |
| 3rd Qu. | 10 |
| Max. | 20 |
| Statistic | Value |
|---|---|
| Min. | 0 |
| 1st Qu. | 25 |
| Median | 100 |
| Mean | 140 |
| 3rd Qu. | 225 |
| Max. | 400 |
| Statistic | Value |
|---|---|
| Min. | -8000 |
| 1st Qu. | -1000 |
| Median | 0 |
| Mean | 0 |
| 3rd Qu. | 1000 |
| Max. | 8000 |
| Statistic | Value |
|---|---|
| Min. | 0 |
| 1st Qu. | 625 |
| Median | 10000 |
| Mean | 35252 |
| 3rd Qu. | 50625 |
| Max. | 160000 |
gt
y_gts <- lapply(y_summary, gt::gt)

# Either prints to RStudio or causes Quarto to fail!
# knitr_tabset(y_gts, .f = print)

# Works by printing tables as html
knitr_tabset(y_gts, ~ cat(gt::as_raw_html(.x)))Nested
y_nested <- purrr::transpose(list(Summary = y_kables, Plot = y_plots))

knitr_tabset(y_nested, ~ knitr_tabset(.x, print))| Statistic | Value |
|---|---|
| Min. | -20 |
| 1st Qu. | -10 |
| Median | 0 |
| Mean | 0 |
| 3rd Qu. | 10 |
| Max. | 20 |
| Statistic | Value |
|---|---|
| Min. | 0 |
| 1st Qu. | 25 |
| Median | 100 |
| Mean | 140 |
| 3rd Qu. | 225 |
| Max. | 400 |
| Statistic | Value |
|---|---|
| Min. | -8000 |
| 1st Qu. | -1000 |
| Median | 0 |
| Mean | 0 |
| 3rd Qu. | 1000 |
| Max. | 8000 |

| Statistic | Value |
|---|---|
| Min. | 0 |
| 1st Qu. | 625 |
| Median | 10000 |
| Mean | 35252 |
| 3rd Qu. | 50625 |
| Max. | 160000 |
Issues
During the creation of this post, I realised this function will not work with the echo: fenced option due to echoed code interfering with the output.
Image Credit
Josh Cowley. September 29th, 2022. “King’s Gate, Newcastle Upon Tyne”.